
Advice you can act on — not just another chart.
Ask it anything about your store and get answers grounded in your real numbers. When it spots a problem, it doesn't just flag it — it hands you the fix as a one-click action. Included in every plan.
- Chat grounded in your actual COGS, fees, VAT and ad spend
- Loss-making products flagged with the price that fixes them
- One-click apply — price changes pushed to Shopify instantly
- Inline fill for missing shipping/VAT, saved across the product
- Weekly digest email with the week's most important profit moves
Know your real profit — on every order, every day.
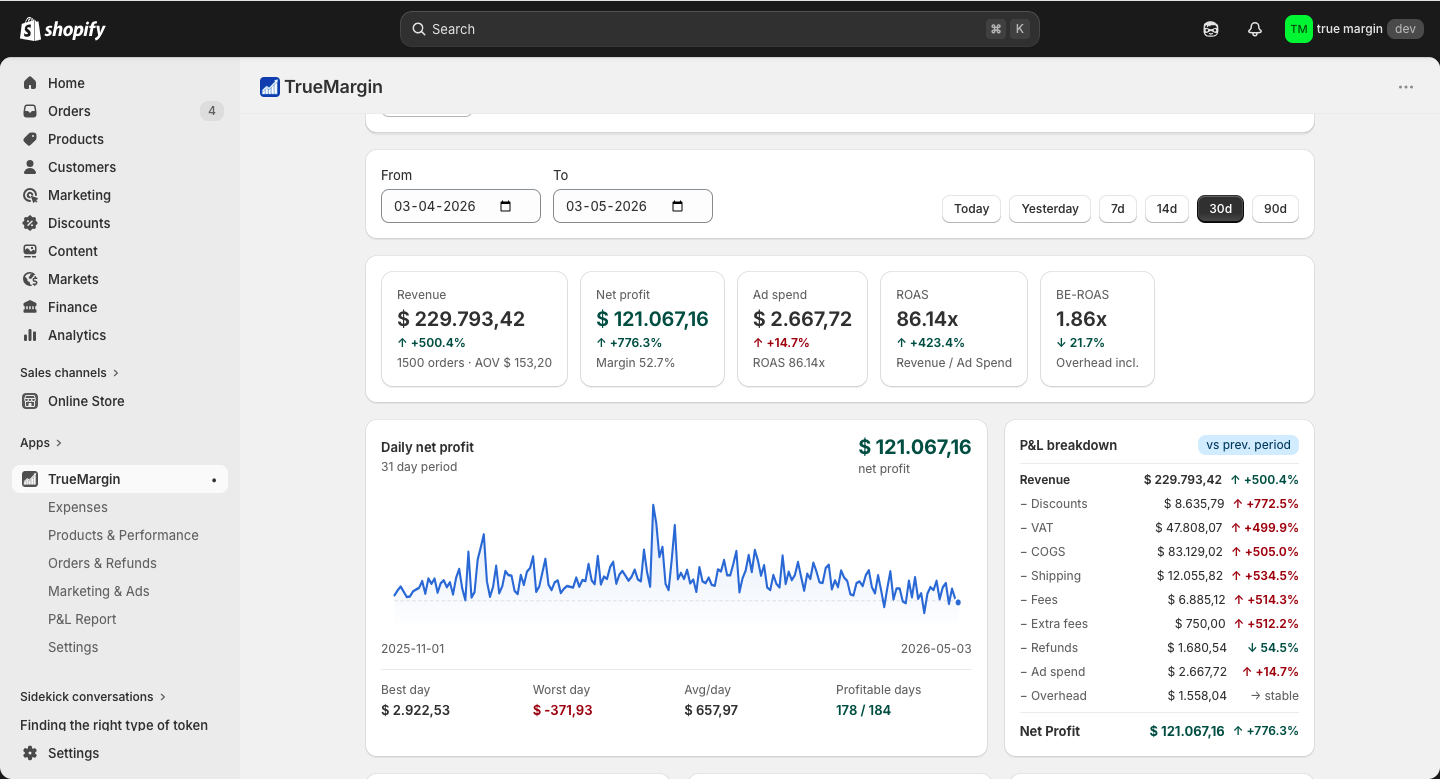
Shopify shows revenue. TrueMargin shows what's left after COGS, payment fees, VAT, refunds and ad spend. Not an estimate — the actual number, per order, live.
- True net profit after every deduction
- Historical COGS versioning — old orders keep their original cost
- Real payment fees from Shopify Payments or your gateway
- VAT-aware margins built for EU stores
Stop spending on ads that look good but lose money.
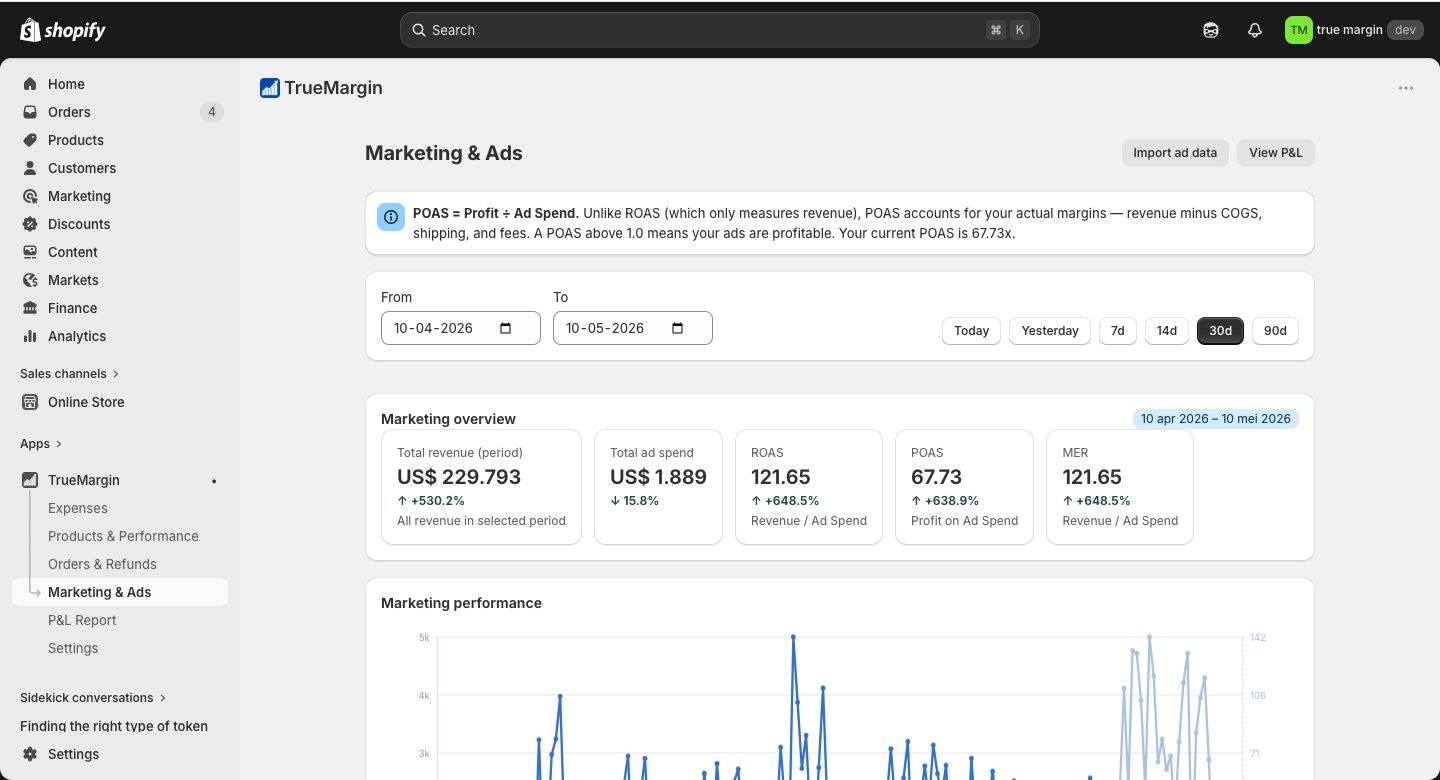
ROAS tells you revenue per ad euro. POAS tells you profit per ad euro — very different numbers. See which campaigns build your business and which quietly drain it.
- POAS = Profit ÷ Ad Spend, not revenue per ad euro
- ROAS, POAS and MER side by side
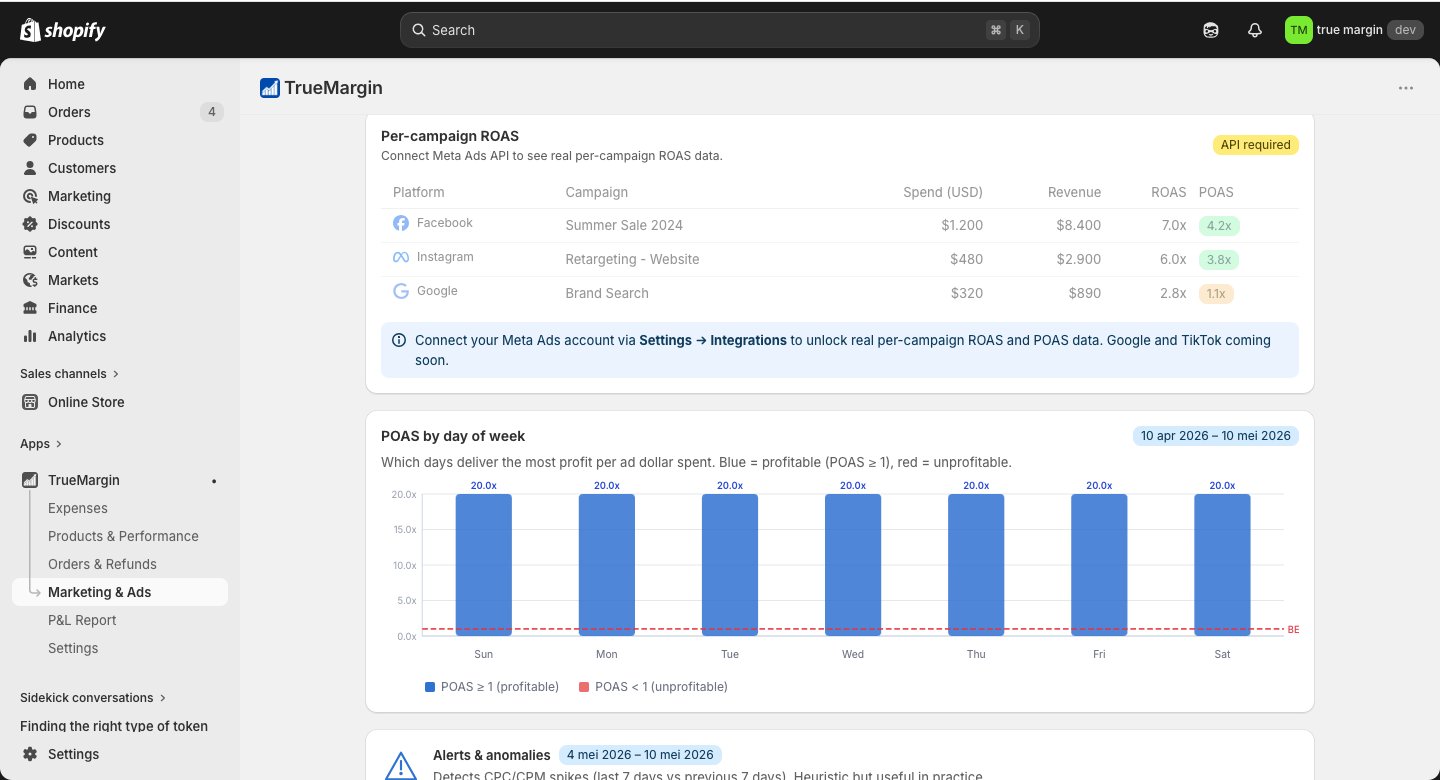
- POAS by day of week — which days actually pay
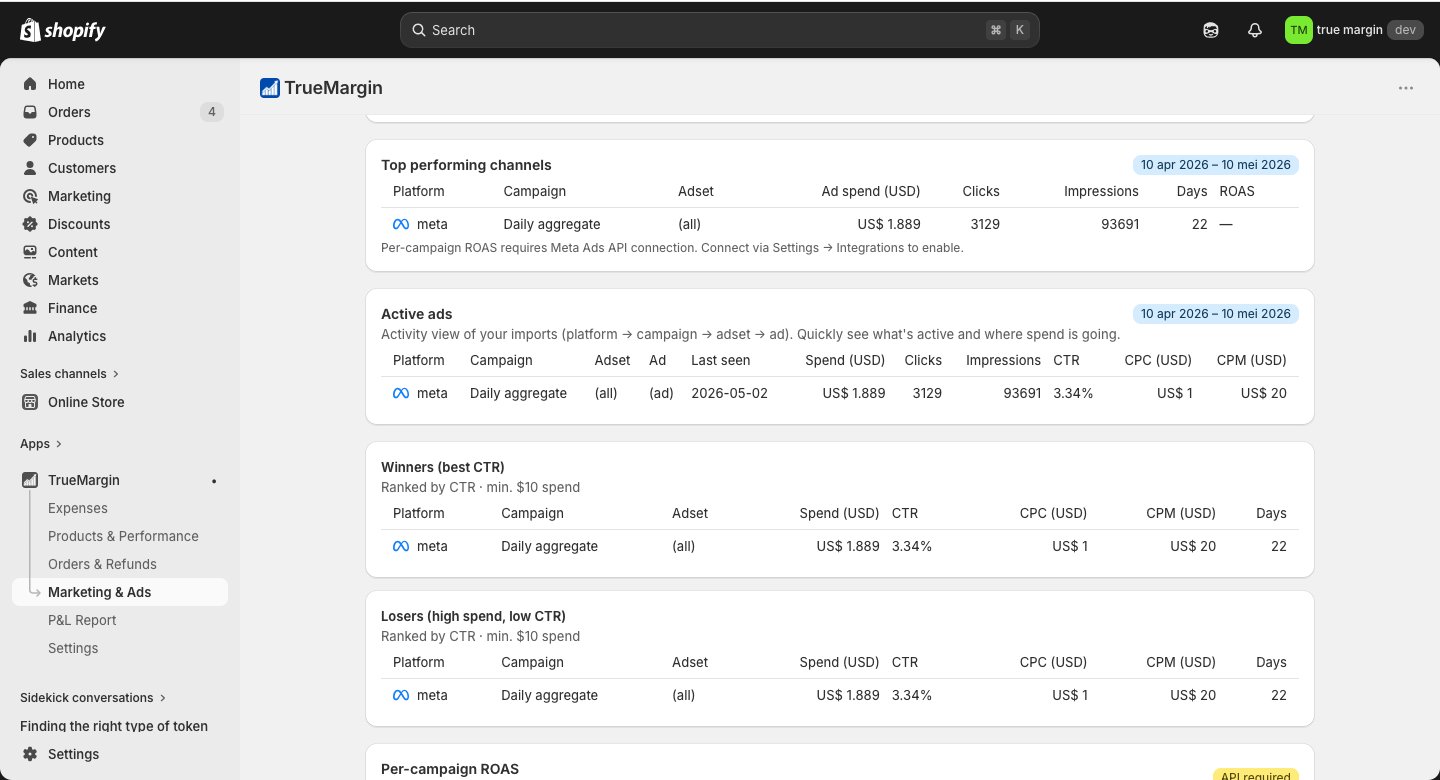
- Winners & losers ranked automatically
- Alerts for CPC/CPM spikes and POAS below break-even
Every order. Every cost. Every margin — in one table.
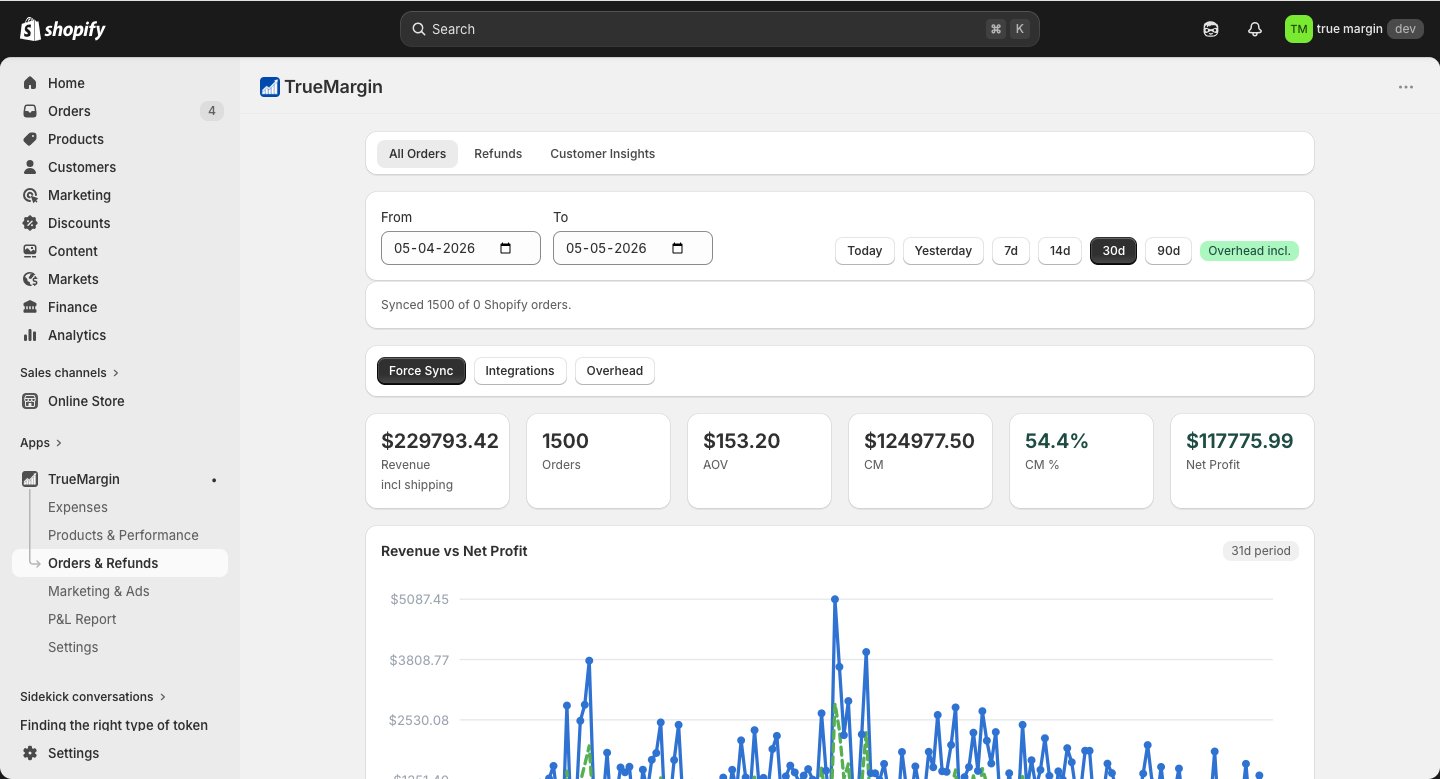
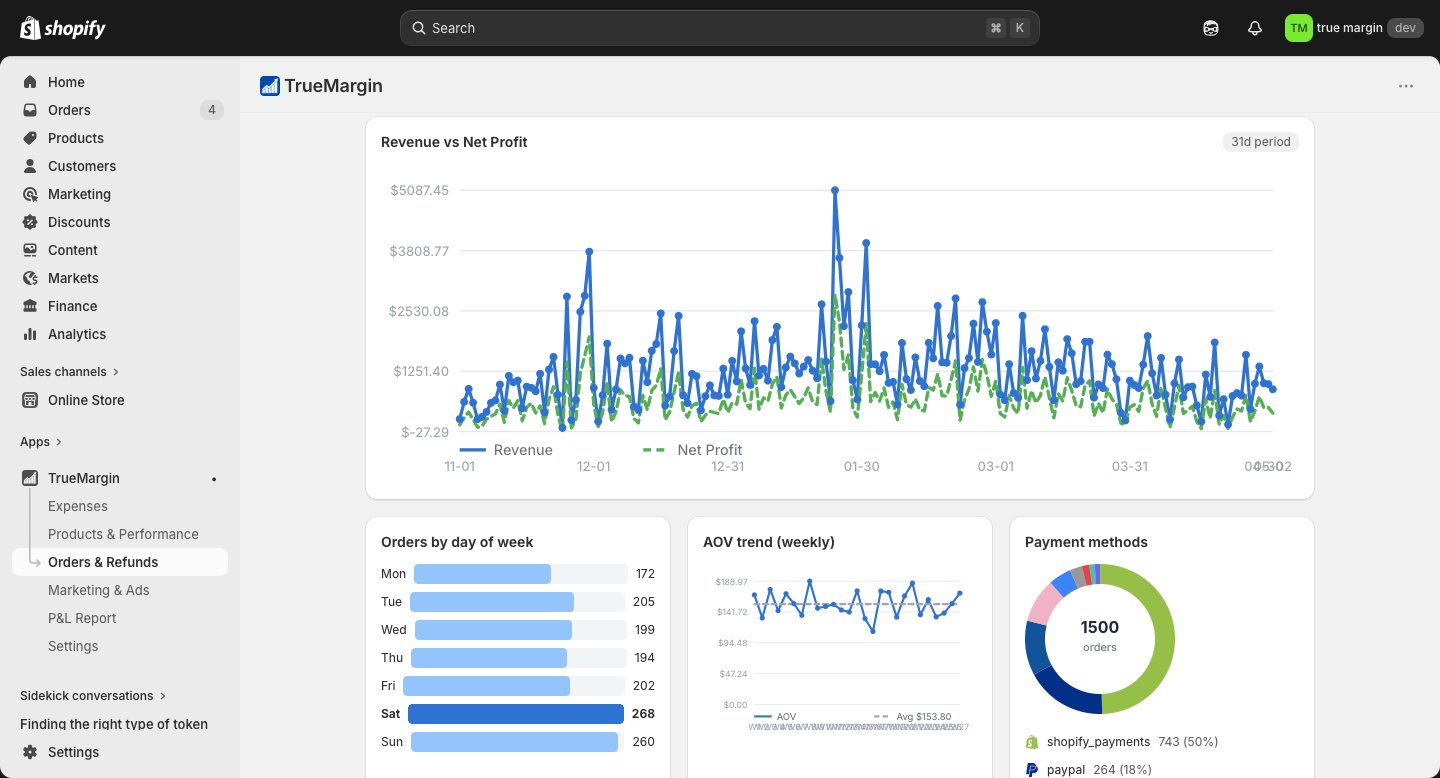
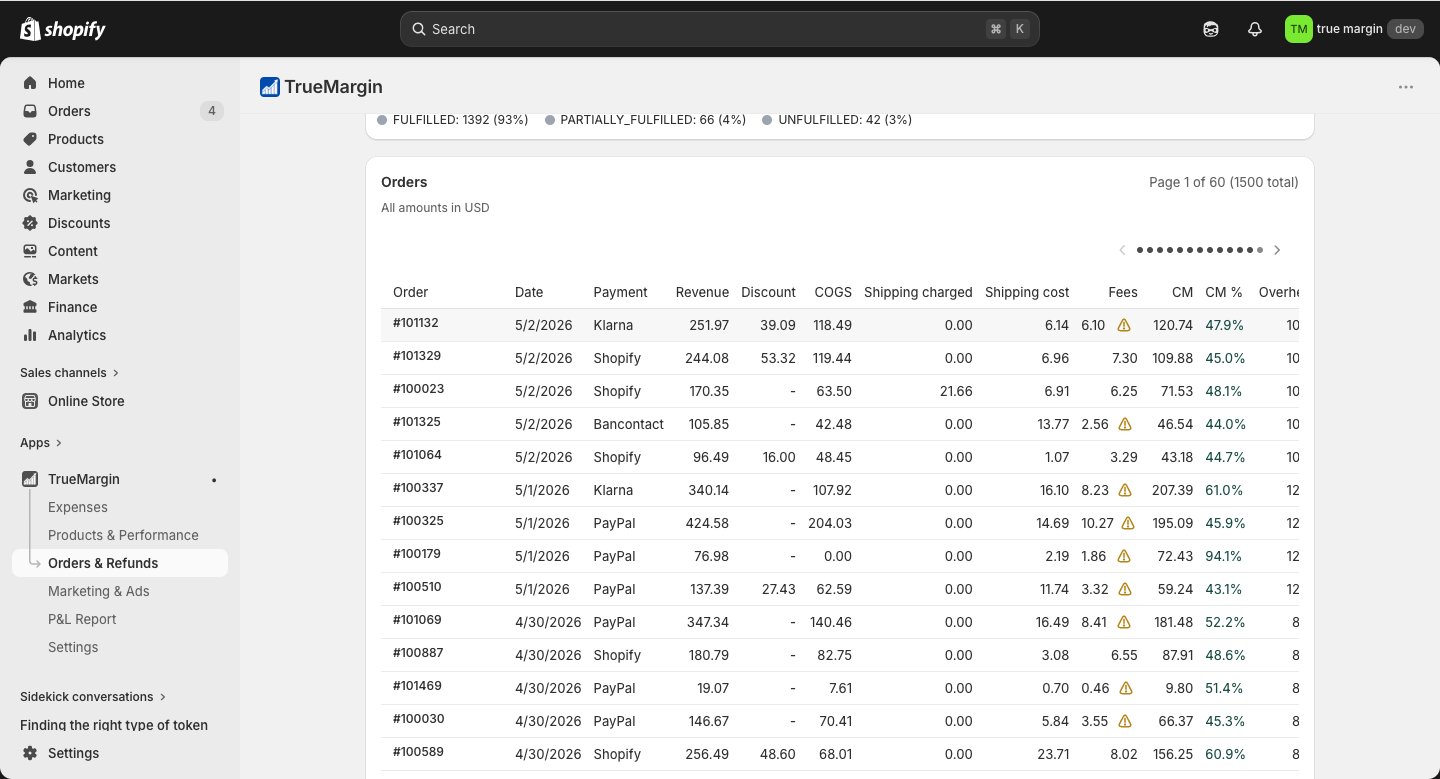
Stop opening order after order in Shopify. See every order with revenue, COGS, shipping, fees, contribution margin and net profit — plus the charts that explain your week.
- Per-order breakdown: revenue, COGS, shipping, fees, CM, net profit
- Revenue vs Net Profit over any date range
- Orders by day of week — best and worst days
- AOV trend with average baseline
- 1500 orders paginated — scroll through every one
Refunds cost more than you think. We show exactly how much.
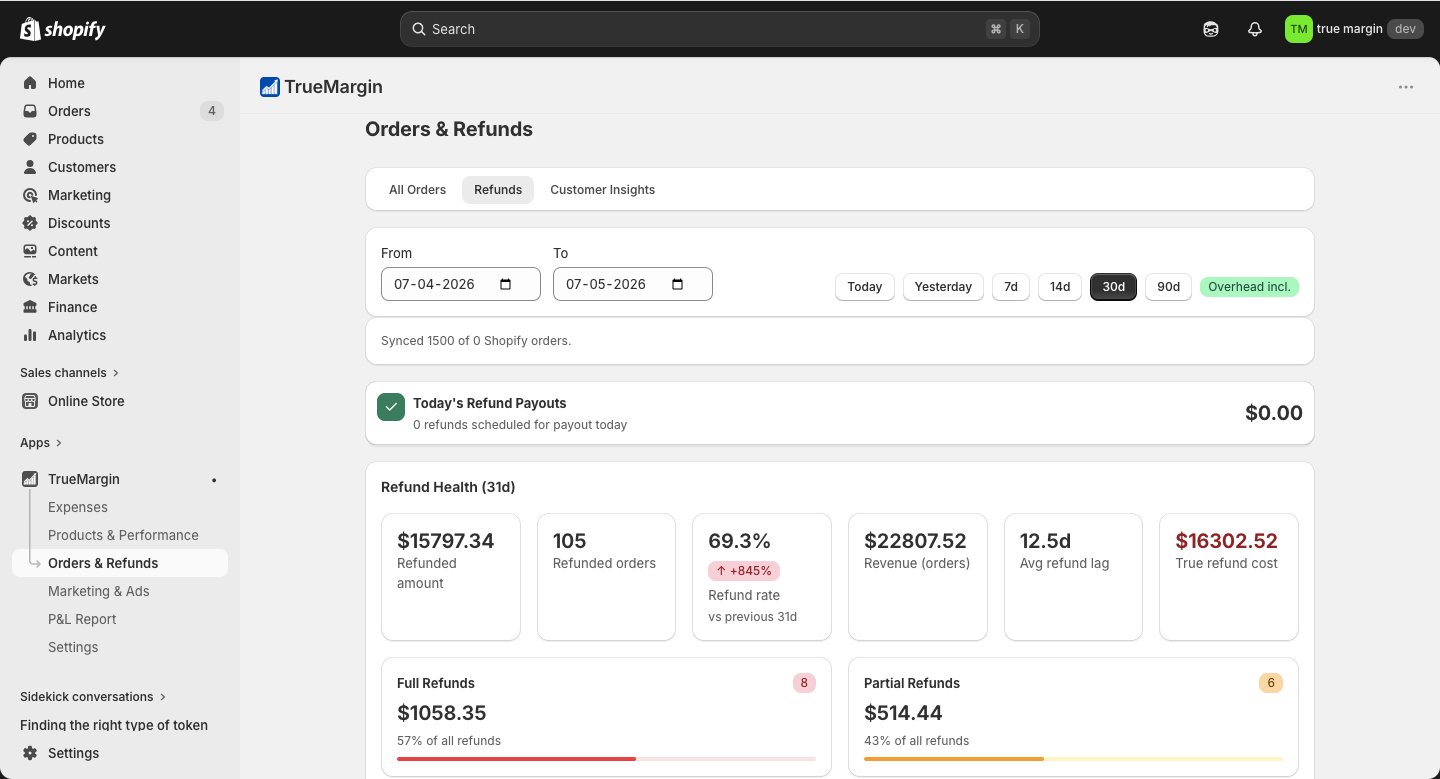
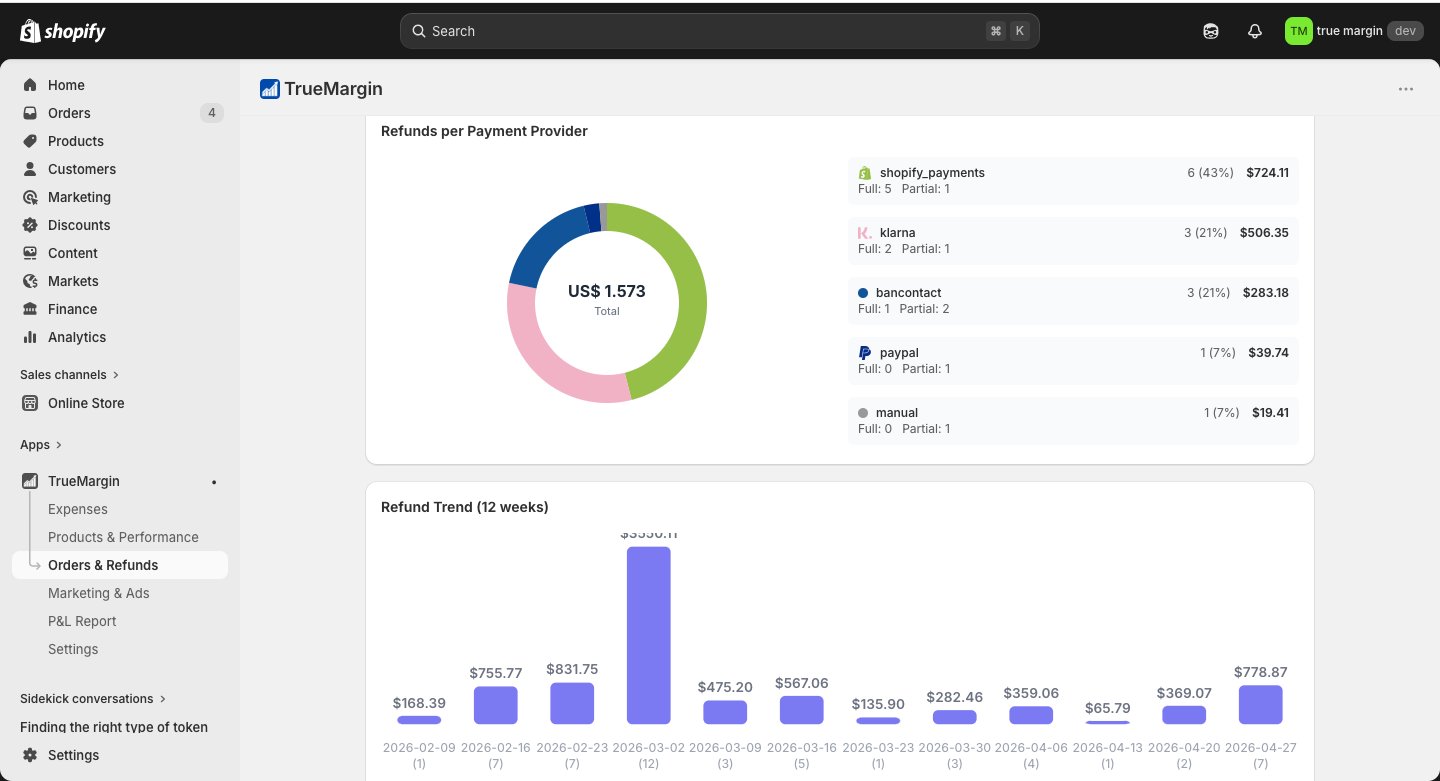
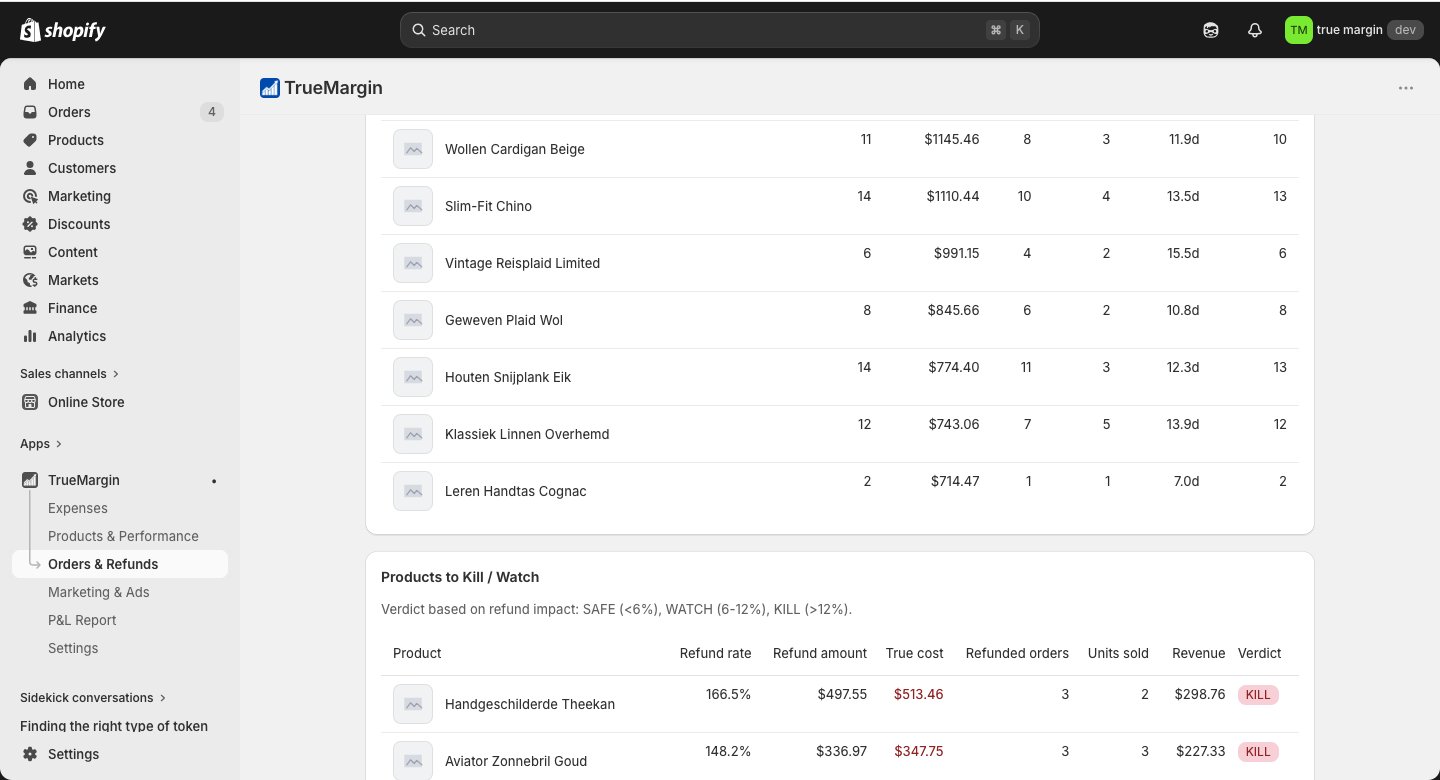
The refund is just the start — you also lose the processing fee, the COGS and the shipping. We track the true cost per product, provider and week, and flag what to kill, watch or scale.
- True cost: refund + processing fee + COGS + shipping lost
- Refund Health KPIs: amount, orders, rate, avg lag, true cost
- Full vs partial refunds split
- Refunds per payment provider
- Products to Kill / Watch: SAFE <6%, WATCH 6-12%, KILL >12%
Know who keeps your business alive — and who's drifting away.
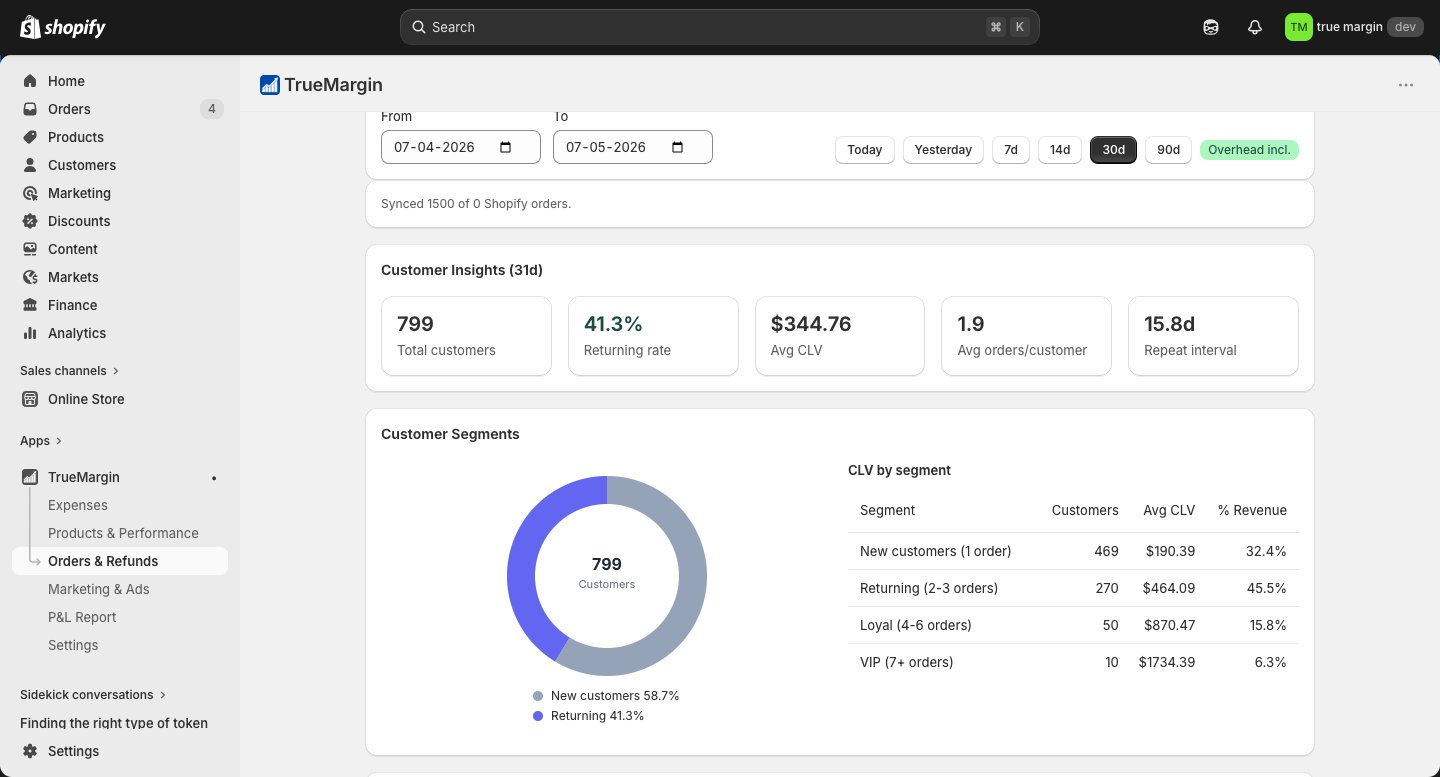
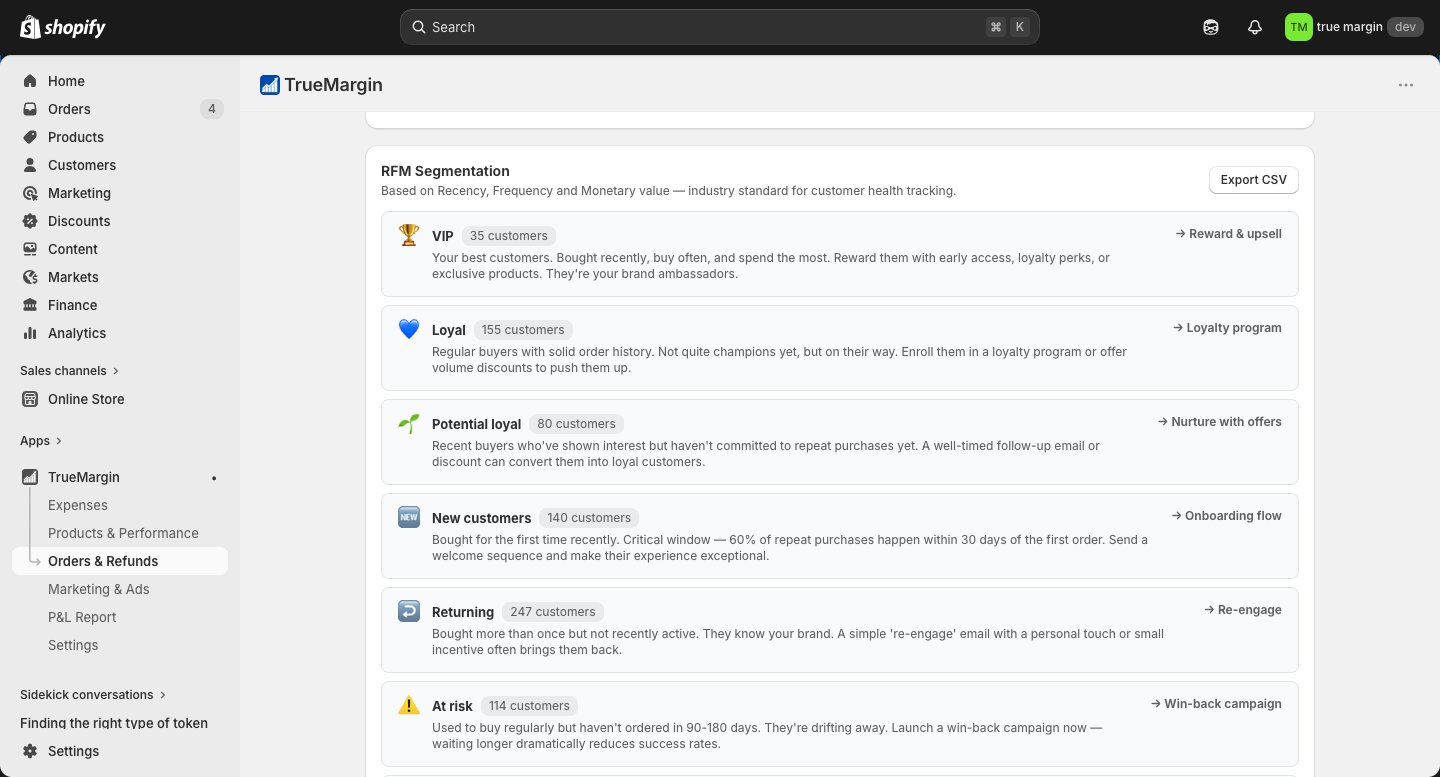
Customers don't all behave the same. TrueMargin segments them automatically by RFM — Recency, Frequency, Monetary. Each segment gets a verdict and a suggested action.
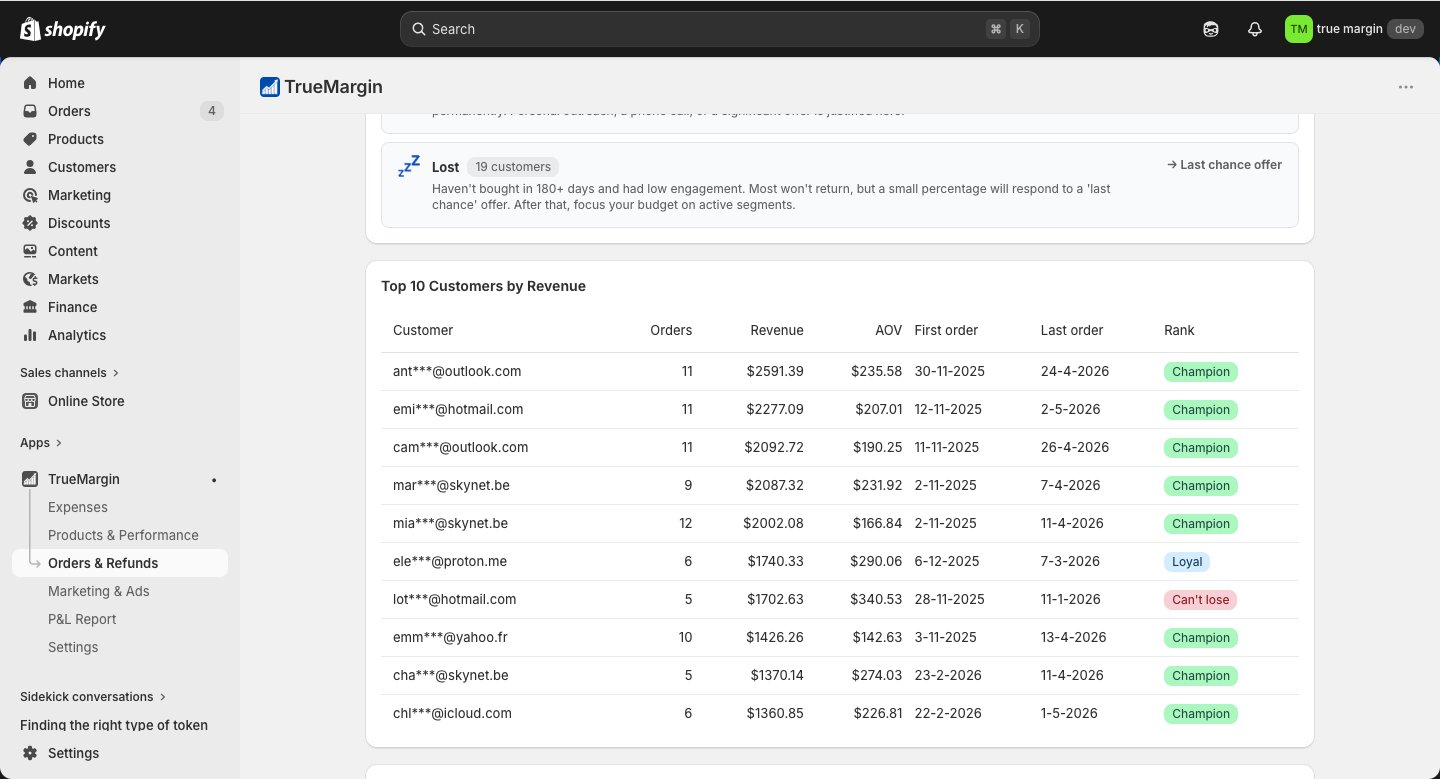
- RFM segments: VIP, Loyal, Potential, New, Returning, At risk, Lost
- Avg CLV per segment — where real value comes from
- Returning rate, avg orders/customer, repeat interval
- Top 10 customers by revenue with masked emails
- Suggested action per segment: reward, re-engage, win-back
Month-end in minutes. Not hours.
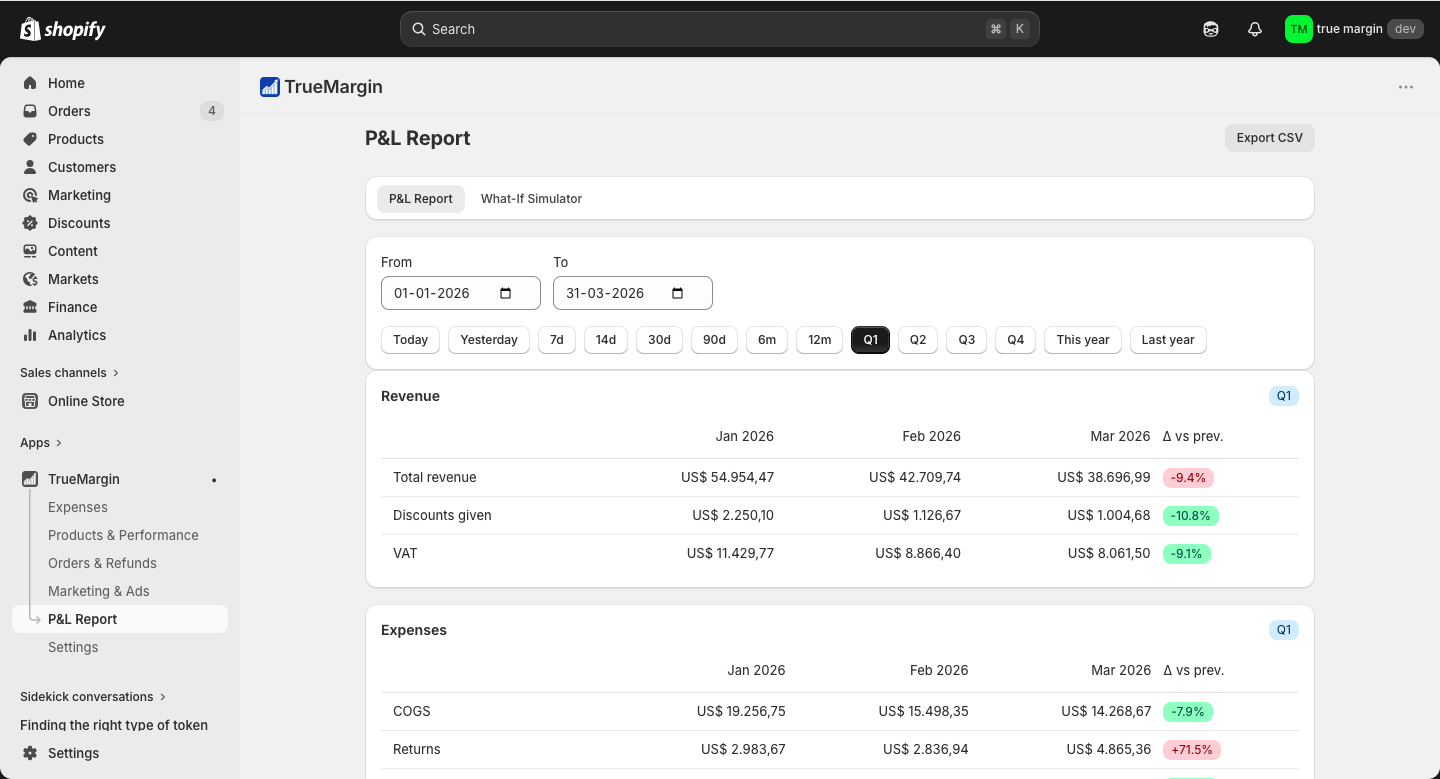
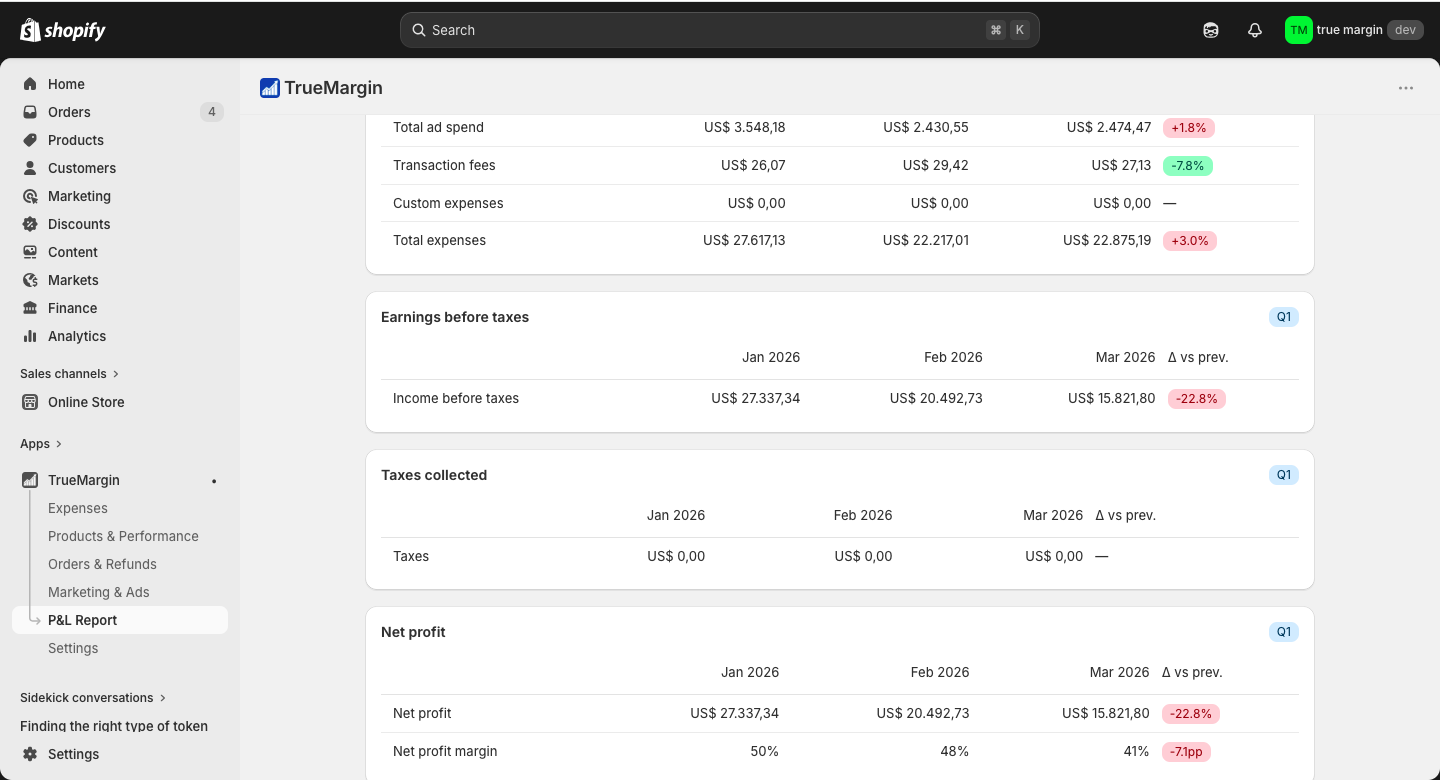
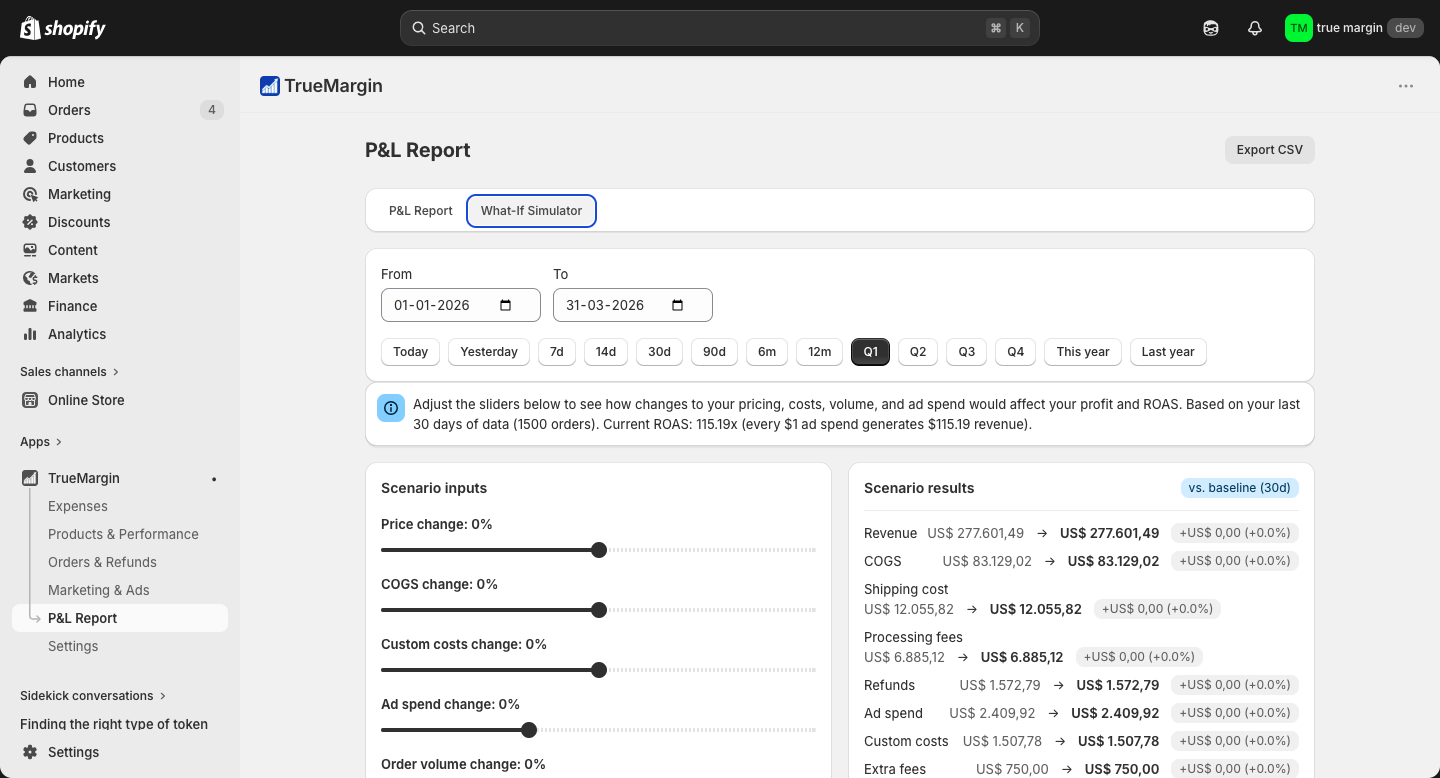
A full P&L statement, filterable by date, with a what-if simulator to model price or cost changes. Export to Excel in one click — ready for your accountant.
- Monthly P&L per column with Δ vs previous period
- Revenue, COGS, expenses, EBT, net profit margin
- What-If simulator: price, COGS, ad spend, volume sliders
- Export CSV — Excel-ready
- Filter: Today, 7d, 30d, Q1–Q4, this/last year
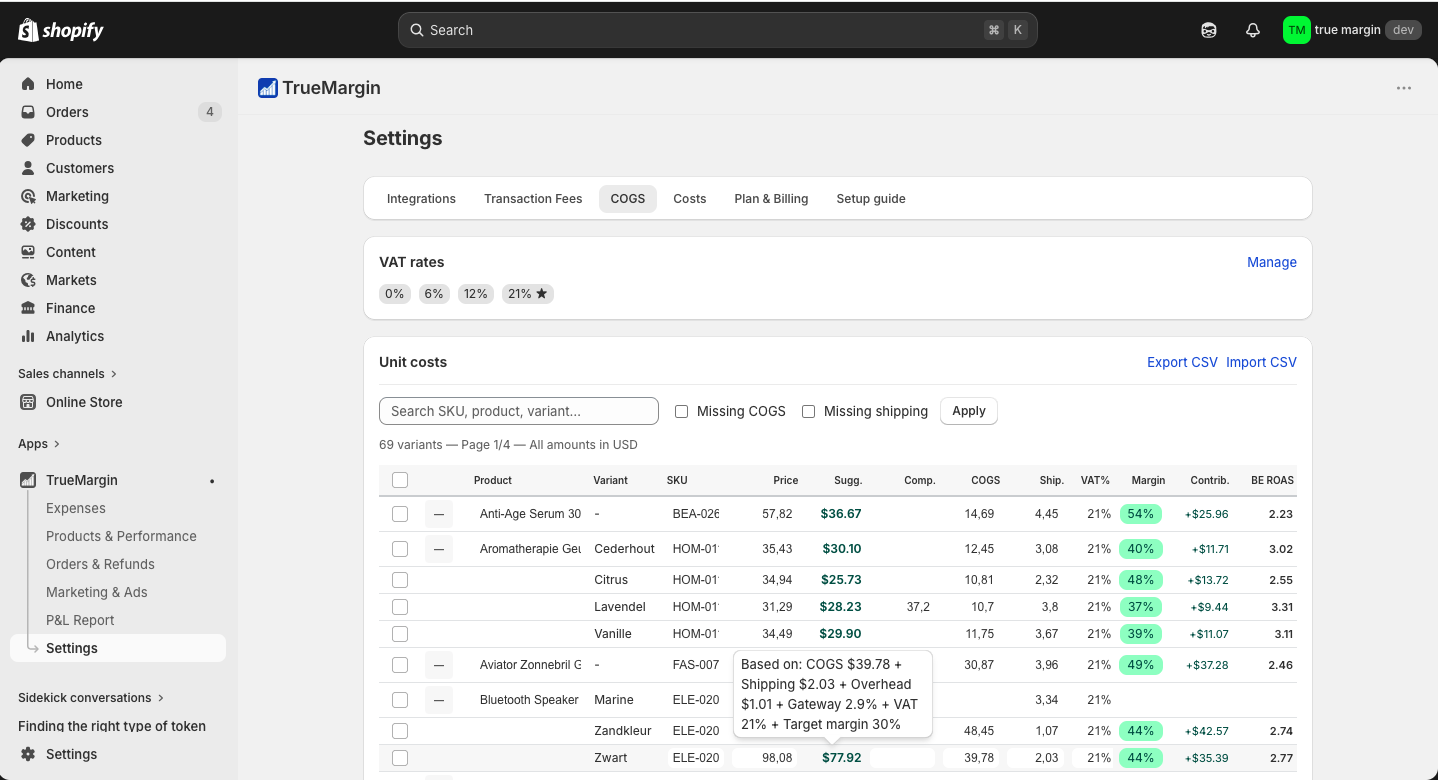
All your product costs. One screen. Synced to Shopify.
One table for every variant — COGS, shipping, price, VAT, suggested selling price, contribution margin and break-even ROAS. Change a cost and it updates everywhere instantly.
- Edit COGS and shipping per variant in one table
- Suggested selling price based on your target margin
- Contribution margin and BE-ROAS per variant
- VAT rate bulk-assignable
- Changes sync back to Shopify automatically
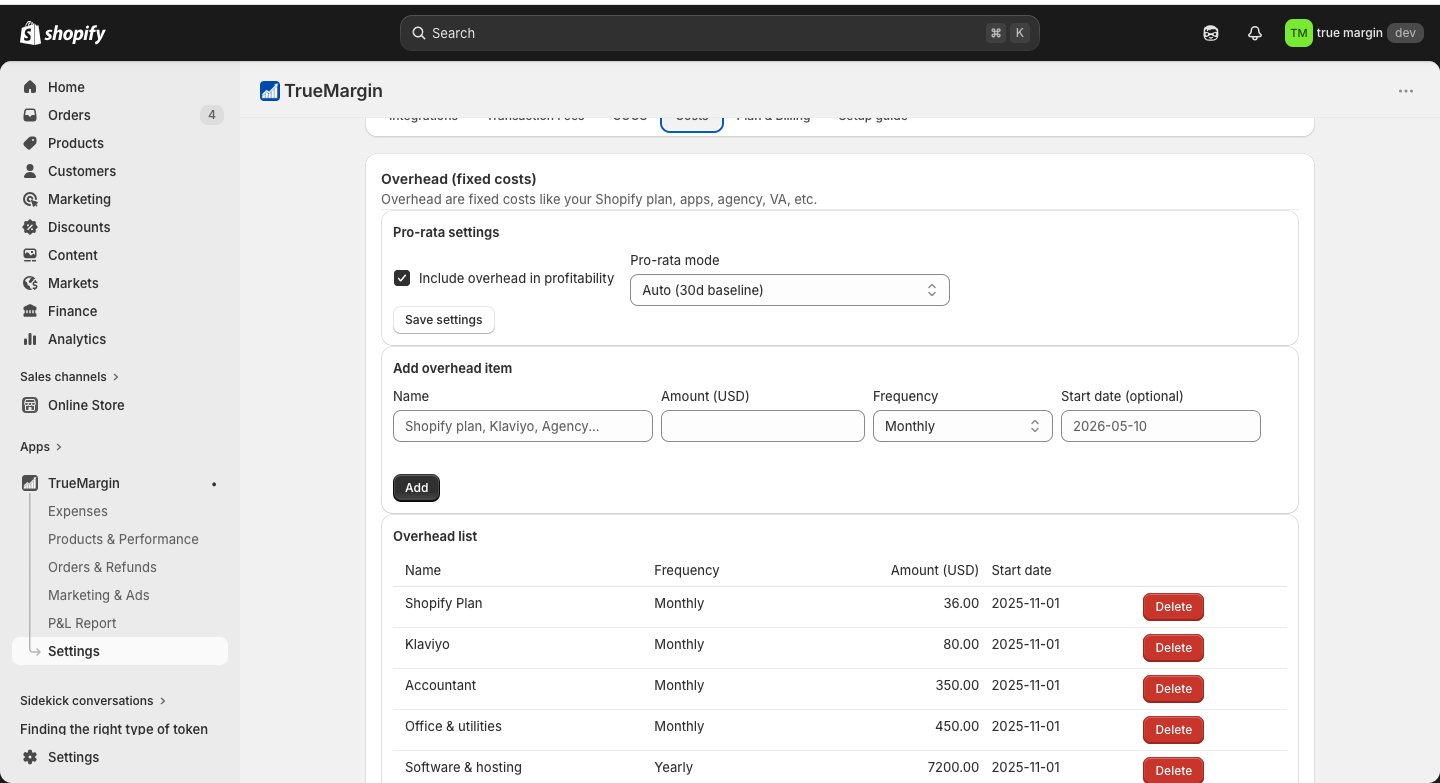
Every subscription and fixed cost — in your profit number.
Shopify plan, Klaviyo, your accountant, office costs — real costs that eat your margin. Add them once, choose the frequency, and they're factored into every P&L automatically.
- Add overhead: Shopify plan, agency, tools, rent, VA
- Choose frequency: monthly, quarterly, yearly, one-time
- Automatically pro-rated across daily profit
- Toggle overhead on/off to compare margins
- Visible in P&L and daily net profit
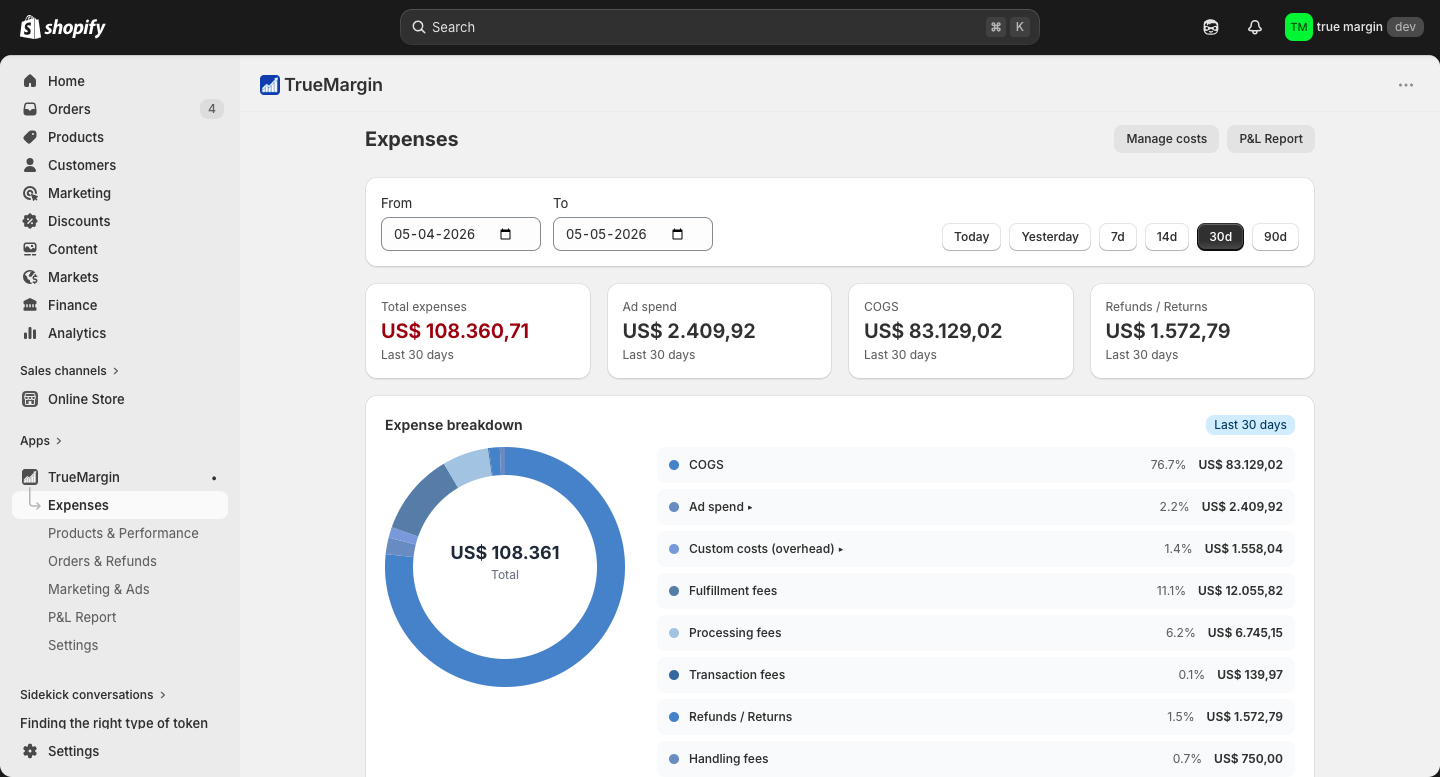
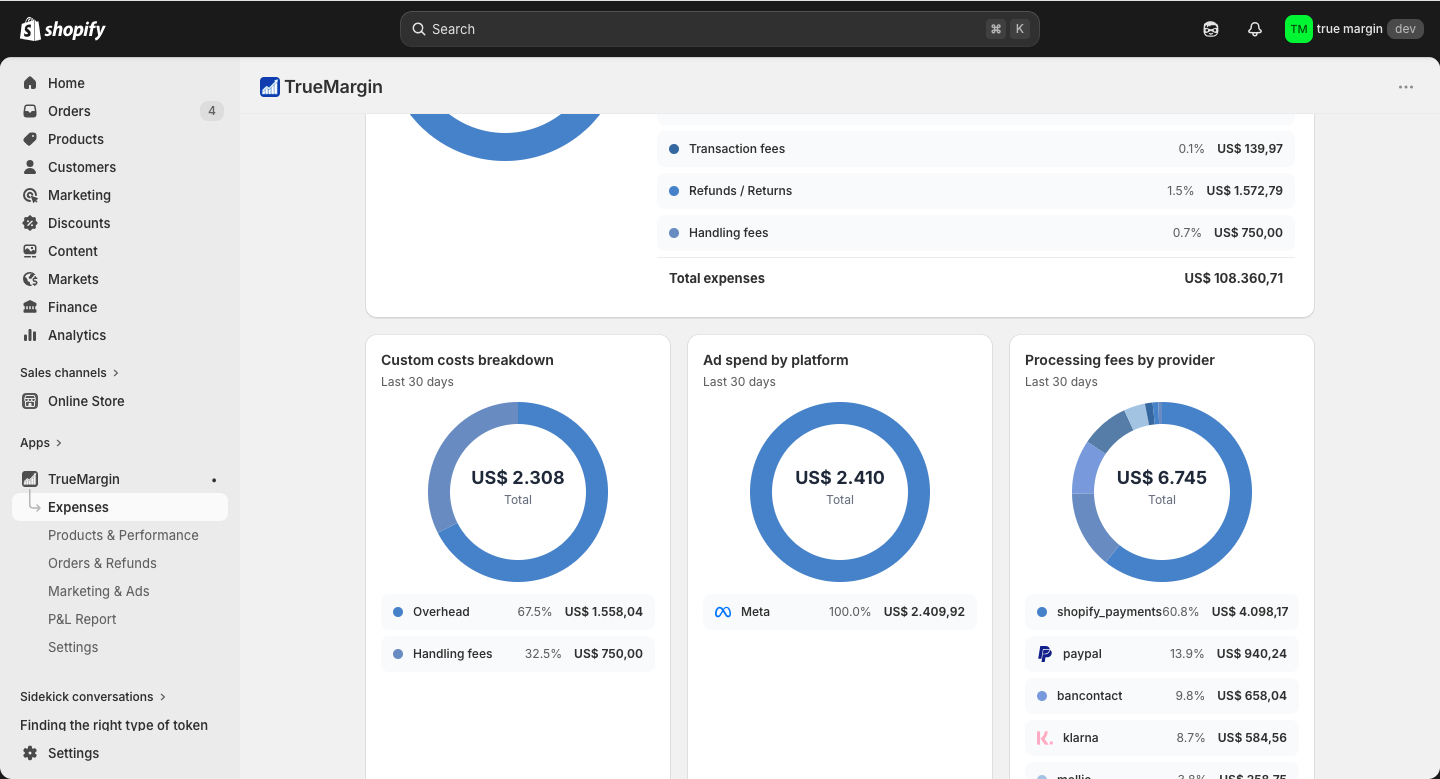
Every euro out — in one place.
Most merchants know their revenue. Few know their full cost structure. Track every category — COGS, ads, fulfillment, fees, refunds and your own overhead. Add once, filter by period.
- Donut breakdown across every expense category
- Ad spend by platform
- Processing fees per payment provider
- Custom costs: handling, fulfillment, label costs
- One filterable report — no spreadsheet
Open. See. Decide.
Pick your date range and everything is already there — your P&L, your margins, your refund health, your ad performance. One screen. Thirty seconds. Done.